


SEO KPIs: What to Track and When
The right SEO KPI depends on the stage of the work. Average position, estimated traffic, organic traffic and leads measure different things at different times.

An SEO KPI (key performance indicator) is a measure that shows whether your search engine optimisation is moving in the right direction. The right KPI depends on the stage the work has reached: average position and estimated traffic at the start, organic traffic and leads once it has matured. Since AI Overviews arrived in Google’s results, counting clicks is no longer enough. You also need to track how often your brand appears and is cited. Mix the stages up and you get a distorted picture of what your SEO is achieving.
Why KPIs Matter in SEO
SEO takes time, so without the right metrics you won’t know whether the work is heading in the right direction until it is too late. There are three good reasons to measure it properly:
- Because results build slowly, you need to know which KPIs show progress at each stage, so you can judge whether the work is on track.
- The right measure for the stage you are at is how you make the case to decision-makers for carrying on.
- KPIs show SEO specialists which piece of work will have the greatest effect.
Here are the KPIs we use, in the order each becomes the main measure: average position → estimated traffic → organic traffic → leads. In the commercial phase we add Google Ads to that ladder, because paid and organic search compete for the same customers on the same results page.
Average Position: The First Sign of Progress
Your average position is the average ranking across the keywords you track. For it to be reliable, measure the same keywords throughout the period you are comparing. The keywords you want to work on come from your keyword research.
Measure average position on a fixed list of tracked keywords, never as an average across the whole domain. Getting this wrong is a common and costly mistake. When SEO starts to work, the site begins to rank for hundreds of new keywords in positions 30–70, and that makes the domain-wide average worse for purely arithmetical reasons. Visibility then appears to be getting worse, even though traffic and the number of ranking keywords are both rising. A fixed list of 50–200 of your most important keywords avoids the problem.
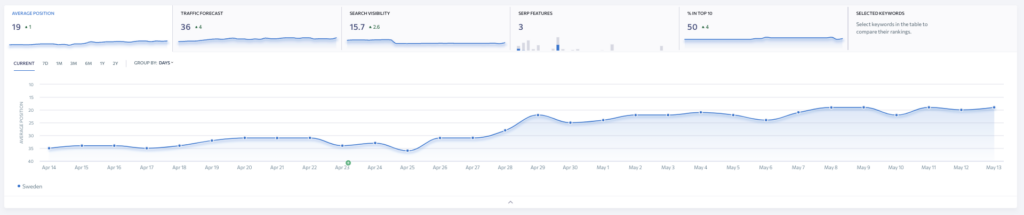
The chart shows one of our clients, whose average position improved from 35 to 19. The next chart shows estimated traffic for the same keywords over the same period.
Average position is usually the first thing to improve when you start on SEO. Keywords can climb a long way without reaching the first page, so the improvement doesn’t necessarily lift your estimated or actual traffic by much.
That makes average position a leading indicator of whether the work is producing results. If it is improving, you are doing something right.
It works best early on, when most keywords rank poorly. After a while it stops being useful: a keyword moving from position 100+ to 20 shifts the average far more than one moving from five to one, yet the second does far more for your estimated traffic.
Estimated Traffic: When Keywords Reach Page One
Estimated traffic is a model of how much traffic the keywords you track should bring. It assumes the top positions take a large share of the clicks and that the share falls quickly further down the page. How large a share each position gets is no longer a fixed figure: click-through rates have shifted sharply as the results page has changed. In a study published in February 2026, Ahrefs found that when an AI Overview appeared, the top-ranking page’s average click-through rate was 58 per cent lower (desktop data, December 2025 compared with December 2023). Treat estimated traffic as a direction of travel, not a precise forecast.
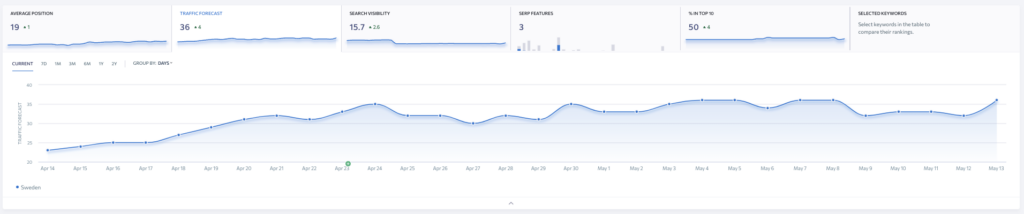
In the chart above, estimated traffic (labelled traffic forecast in the tool) has risen from 23 to 36, for the same website and dates as the average position chart. Over a month that is very little extra traffic, and it hardly affects the business. Judged on estimated traffic alone, the work would look weak; at this stage the improving average position tells you far more. The opposite also happens: average position gets worse while estimated traffic rises, typically when a few high-volume keywords climb while many new keywords enter low down.
You generally only get meaningful estimated traffic from Google’s first page. In a new project it takes time to rank there, so this is not the KPI to start with.
Once the project matures, though, estimated traffic is a better measure than average position, because it takes each keyword’s search volume into account. It climbs steeply when higher-volume keywords approach the top half of the first page.
Bear in mind that estimated traffic ignores seasonality, so it won’t always match what you see in practice. For SEO, that is also its strength: it gives a stable measure that external factors don’t move.
Informational content often loses clicks when Google answers the question directly in an AI Overview, but that rarely means the content has stopped working. Seer Interactive found that on searches showing an AI Overview, a brand’s organic click-through rate was 35 per cent higher when it was cited than when it was not (Q3 2025 averages, from 3,119 queries across 42 client organisations), although Seer notes that it cannot prove the citation is the cause. Estimated traffic doesn’t capture that value, so for your buying guides and informational pages, also track how often you appear and are cited (more on that below).
Organic Traffic and Where to Measure It
Organic traffic is the visits you get from Google’s unpaid results, and this is where many people go wrong: GA4 doesn’t show all of it. Its tracking script runs in the visitor’s browser and depends on consent, so part of your traffic disappears from the data whenever someone declines. Add ad blockers and scripts that load too late, and the gap can be considerably larger. Google Search Console records clicks at Google’s end, so cookie banners and ad blockers don’t affect it. Use Search Console as the source of truth for how many people searched and clicked, and GA4 for what visitors did after they landed: engaged sessions, engagement rate and key events. (In GA4, bounce rate is simply the share of sessions that were not engaged.)
A useful rule of thumb: if clicks in Search Console are stable but organic sessions in GA4 drop sharply, the cause is almost always a tracking fault, not a Google penalty. Check the cookie banner and make sure tracking loads as it should before you draw any conclusions.
Compare organic traffic with the same period last year, which takes seasonal effects out of the comparison. To see what each landing page brings in from search, open Reports → Engagement → Landing page in GA4 and add a filter for Session default channel group: Organic Search; without a filter, the report mixes every channel. Separating the traffic your SEO produced from traffic you would have had anyway is a different split, covered next.
Split Brand and Non-Brand Traffic
If you measure organic traffic without separating searches for your name from generic searches, you get a distorted picture. Crediting SEO with a rise in brand searches means taking credit for what PR, advertising and general awareness produced. The trend in non-brand traffic is what shows whether your SEO is reaching new customers.
| Type of search | What it is | What mainly drives an increase |
|---|---|---|
| Brand | Searches that include your company or product name | PR, offline advertising, general awareness |
| Non-brand (generic) | Searches for a product, service or problem where the customer has not yet chosen a supplier | Your SEO work and new rankings |
Search Console can make the split for you. Its branded queries filter in the Performance report divides queries into branded and non-branded. Google introduced it in November 2025 and made it available to all eligible sites in March 2026. It only works on top-level properties with enough search data, and because an AI-assisted system decides what counts as branded, some queries will be misclassified. Where the filter isn’t available, use Filter by query with a regular expression that matches your name and its common misspellings (for a company called Acme, something like acme|akme), once to include those queries and once to exclude them.
Either way, you can show management how non-brand traffic is developing without mixing in traffic you would have had anyway. The split isn’t exact: Search Console leaves out rare queries to protect users’ privacy, and once you filter by query, those anonymised queries drop out of the totals as well. Read the trend over time rather than treating the two figures as a complete account.
How to Measure Leads from SEO
In the end, SEO is there to win you customers. If the number of leads from SEO is rising, the work is paying off.
As organic traffic grows, leads should follow. Once the work is well advanced, measure leads from SEO the same way as organic traffic, against the same period last year, and keep the definition of a lead in GA4 the same throughout: change it and you can no longer compare.
Not all traffic is worth the same. Traffic from AI chatbots and LLM-based search is still small, but those visitors can convert far better. In June 2025, Ahrefs reported that on its own website, visitors from AI search converted at 23 times the rate of traditional organic search visitors. They have often done their research in the conversation with the AI and arrive ready to do something specific, so a small number of those visits can be worth more than the volume suggests. Don’t write off a channel because the volume is low; look at what the visits lead to.
How to Track Visibility in AI Answers
Visibility in AI answers measures how often your brand appears and is cited in AI Overviews and chatbots, rather than how many people click through. For informational content it is now the measure that counts, because Google often answers the question on the results page without sending the visitor anywhere.
You can be cited without ranking highly in the usual way. In a study published in March 2026, Ahrefs found that 38 per cent of pages cited in AI Overviews also ranked in the top 10 for the same query. Watching average position alone therefore misses a large part of your visibility.
Two KPIs to start tracking for informational pages:
- Citation rate in AI answers: how often your page is given as a source or link inside the AI Overview for your priority keywords.
- Growth in brand searches and direct traffic: when you appear in AI answers, some people get their answer straight away and then search for your name or go directly to your website. A rise in brand searches and direct traffic can be a sign that your exposure in AI answers is working, but PR and advertising move the same figures, so read it alongside your citation rate.
In practice, a buying guide can lose half its clicks and still be worth more than before, if it is cited as a source and the people who do click through are closer to buying. So measure the right thing for each page: clicks and conversions on your commercial landing pages, citation rate and reach on your informational pages.
The Commercial Phase: Track SEO and Google Ads Together
In the commercial phase, when you are working towards leads, sales and revenue, you can no longer look at SEO in isolation. Organic search and Google Ads compete for the same customers on the same results page, and each affects the other.
An example: say your landing page turns 2 per cent of visitors into leads, while your competitors’ pages convert 3 per cent. They can then bid more per click in Google Ads and still make more money than you. The page improvement that lifts your organic conversion rate also makes your advertising more profitable, and measuring the two separately hides that connection.
In the commercial phase, track:
- Leads and revenue from non-brand organic search.
- Leads and revenue from Google Ads, broken down by keyword.
- The total cost per lead across both channels.
- How an improved landing page affects both organic conversion and the profitability of your advertising.
Improving your website is usually a one-off investment, whereas a higher ad budget carries on month after month. When SEO and Ads are measured together, you can see where the money does the most good. Our SEO and PPC page explains how we run the two together.
Use Your SEO KPIs to Decide What to Do Next
The four KPIs on the ladder aren’t only for reporting; they also tell you what to do next. Read regularly, they show a project’s momentum and which parts of your SEO to prioritise.
If you are losing rankings, first check whether average position is getting worse across the board or only a few keywords are slipping:
- If all your keywords rank poorly, look at site-wide issues such as technical SEO or links from other sites.
- If a few keywords lag well behind the rest, the problem lies with those pages, typically their on-page SEO.
If organic clicks fall while brand searches and direct conversions rise, check your citation rate in AI Overviews before you conclude that the SEO has stopped working.
If you want SEO measured by the business it brings in, our SEO agency page explains how we work, and a free search audit shows where your site stands today.
Frequently Asked Questions About SEO KPIs
What Does KPI Stand For?
KPI stands for key performance indicator: a measure of how well you are performing against a defined goal. For SEO, that means metrics such as average position, organic traffic and leads.
What Is a Good KPI for SEO?
A good SEO KPI reflects the stage your project has reached and your business goal. Early on, average position on a fixed keyword list works well; later, non-brand organic traffic and leads. There is no single template: a retailer looks at sales, a B2B firm at qualified leads.
How Do You Track SEO Performance?
Use Google Search Console for how many people searched and clicked, and Google Analytics 4 (GA4) for what visitors did after they landed. Search Console is the more reliable source for clicks, because cookie banners and ad blockers don’t affect it.
How Often Should You Review Your SEO KPIs?
Review them monthly to see the momentum, but draw conclusions by comparing with the same period last year. Month-on-month comparisons often mislead, because search behaviour is seasonal.
If you would like help choosing your SEO KPIs and setting up the measurement behind them, see how we handle measurement and analytics, or get in touch.